


Fatigue design of bridges
Although the fatigue limit state is an ultimate limit state, it requires a different approach to design from that of other limit states because failure is associated with the cumulative damage caused by repeated application of ‘common’ levels of stress. Overall ultimate strength is therefore irrelevant and stresses must be based on elastic stress analysis, with no plastic redistribution, taking account of shear lag and geometrical configurations that lead to stress concentrations. Fatigue life depends not on the basic strength of the structural element but on the actual stresses at positions where attachments are made or where the shape of the member changes.
This article provides a general introduction to the mechanism of fatigue, the relationship between stress and fatigue life, and the simplified method of assessment given in the Eurocodes, notably in BS EN 1993-1-9[1] but also in BS EN 1993-2[2], BS EN 1992-2[3] and BS EN 1994-2[4], each as implemented by its UK National Annexes [5] [6] [7][8]. Guidance is also available in PD 6695-1-9[9].
Additional guidance is available in Section 6.6 of SCI P356 and examples of fatigue assessment are given in the two worked examples in SCI P357.

[top]The mechanism of fatigue

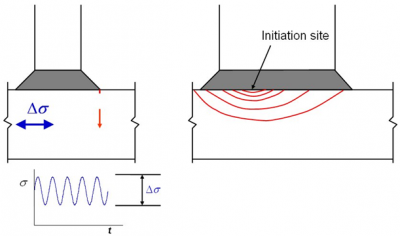
Fatigue failure occurs when unavoidable small crack-like discontinuities grow under repeated application of stress until fracture occurs, usually due to tensile forces on a reduced net cross-section.
In plain smooth material, the discontinuities are very small and most of the ‘fatigue life’ is taken up with the development of an initiating crack. When there are welded attachments on the surface of steel components there are inevitable minor imperfections at the toes of the welds and these grow under repeated stress variation. Other surface imperfections will also grow under repeated stress. The growth rate depends on initial crack size, stress range and geometrical discontinuities.
Crack growth is due to stress variation, not to the absolute level of stress and thus cracks will grow even in regions under predominantly compressive stress - the tip of the crack sees a closing and opening effect due to the reduction and re-imposing of overall compression and this propagates the crack in the same way as an increase and relief of overall tension.
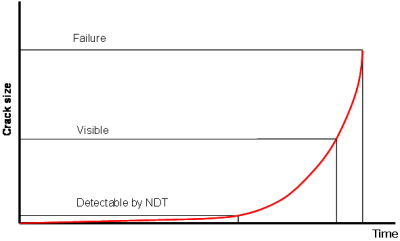
For most of the life of the structure, a crack-like defect is very small; it only becomes detectable by Non-Destructive Testing (NDT) well into its fatigue life and only becomes visible quite close to the end of the fatigue life.
[top]Relationship between stress range and fatigue endurance
Very many tests over very many years have established the relationship between a constant amplitude stress range and fatigue endurance - the number of cycles to failure - for a wide range of structural steelwork details. It has been found that these results for any particular detail are best presented on a log-log graph, and the relationship can then be expressed as a straight line. However, below a certain amplitude of stress range, the fatigue life is indefinite; this level is referred to as the non-propagating stress level. The curve of stress level against endurance is generally as shown below. The slope of the line (1 in m) indicates the relationship between stress and number of cycles - the value of m is typically 3.
In BS EN 1993-1-9[1], a family of design curves are presented, for a range of different detail categories. In these curves, a ‘transition’ line has been introduced for design purposes (this is of use when making damage summations, see below).
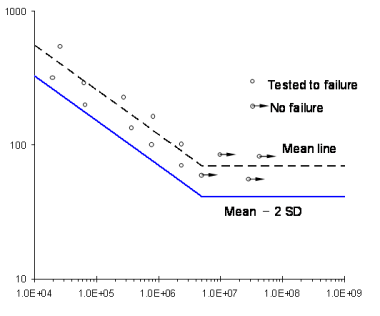
Test results for fatigue endurance of a detail
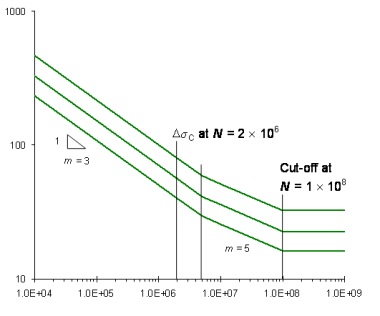
Typical design lines in BS EN 1993-1-9[1]


For each detail, the equation for the line up to N = 5 × 10⁶ cycles is given by:

In which m =3 and ΔσR is the design life at 2 × 10⁶ cycles.
The line between 5 × 10⁶ cycles and 108 cycles continues at a slope of m = 5.
[top]Detail categories
BS EN 1993-1-9[1], Tables 8.1 to 8.10 present numerous detail categories, each category being numbered, each having a design curve like those above. The number of the category indicates the constant amplitude stress range (in N/mm2) for which the design value of endurance is 2 x 10⁶ cycles.
The tables cover plain material, welded connections, bolted connections and connections in tubular construction. Designers will need to become familiar with these tables, though in practice only a modest number of them will be appropriate for typical composite highway bridges.
| Detail category | Construction detail | Description |
|---|---|---|
| 125 |  |
Continuous longitudinal welds: 1) Automatic butt welds from both sides 2) Automatic fillet welds |
| 112 |  |
3) Automatic fillet or butt weld from both sides but containing stop/start positions 4) Automatic butt welds made from one side only, with a continuous backing bar. without stop/start positions |
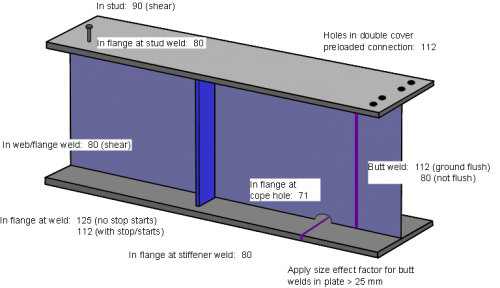
The attachment of web stiffeners or other elements not carrying load in the stressed direction usually produces a category 80 detail. Reinforcing plates and bearing plates welded to the underside of the flange usually introduce a category 40 or 45 detail. Shear stud connectors introduce a category 80 detail in the plate to which they are attached, but see further comment below about the shear stress category for load transferred to the stud. Slip-resistant bolted splices introduce category 112 details for double covers or category 90 for single covers. Transverse butt welds create category 80, 90 or 112 details and introduce a size effect reduction factor for thicknesses over 25mm (see BS EN 1993-1-9[1], Section 7.2.2).
The reliability of the classification of a particular detail depends on some presumption about the quality of workmanship; in some cases specific mention is made in the tables of the NDT needed to demonstrate the validity of the category. There are no detailed references to BS EN 1090-2[10] but that Standard does provide four ‘execution classes’. Class EXC3 is likely to apply for most highway bridges, because they are subject to repeated fluctuation of loading. Where it is necessary to achieve an enhanced level of quality to meet specific fatigue strength requirements, BS EN 1090-2[10] gives additional acceptance criteria in terms of the detail category for the welded joint location.
Any feature that cannot be assessed because there is no similar appropriate detail category should be tested or modified so that the fatigue resistance can be properly evaluated.
Fatigue detail classification for shear transfer
Most of the details in BS EN 1993-1-9[1], Tables 8.1 to 8.5 relate to direct stress Δσ. Two detail groups relate to shear stress; for these the shear stress, ![]() is used but otherwise the procedure for determining the design strength is the same as for direct stress. The design curves for shear have a constant slope of m = 5.
is used but otherwise the procedure for determining the design strength is the same as for direct stress. The design curves for shear have a constant slope of m = 5.
For shear stud connectors, BS EN 1994-2[4], Section 6.8.3 gives a reference stress ![]() of 90 N/mm2, for a shear stress determined on the basis of the cross sectional area of the shank of the stud and the variation of shear force.
of 90 N/mm2, for a shear stress determined on the basis of the cross sectional area of the shank of the stud and the variation of shear force.
[top]Effects of varied stress ranges
Bridges are subject to a wide spectrum of stress ranges - ranges in magnitude of the stress and in number of cycles in a given period. It has been established that fatigue endurance when subject to a spectrum of stress ranges can be assessed by ‘damage summation’ and this is expressed in the Palmgren-Miner rule, which may be stated as:

Where ni is the number of cycles with a stress range of Δσi and Ni is the design value of the fatigue endurance for that stress range.
For a satisfactory assessment, D is less than or equal to 1.0
Clearly the undertaking of a realistic assessment for multiple stress ranges is a lengthy task and requires detailed knowledge of the stress range spectrum. Assessment on such a basis is given only in Annex A to BS EN 1993-1-9[1] and it is invoked by the UK National Annex[5] only when the simplified method cannot be used. For highway bridges, the simplified method is used in all but exceptional cases.
[top]Use of the simplified load model
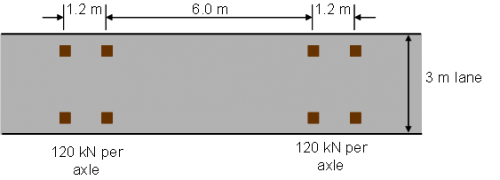
BS EN 1993-2[2] says that for the fatigue assessment of road bridges, the simplified fatigue load model (FLM3) should be used. Instead of a spectrum of vehicles of different configurations and weights a single notional vehicle is considered, as defined in BS EN 1991-2[11].

An elastic global analysis of the structure is performed, to determine the ‘reference stress range’ as this load model travels the length of the bridge, along the traffic lane.
From the reference stress range a ‘damage equivalent stress range’ related to 2 x 10⁶ cycles is determined. In effect the cumulative damage due to a projected volume of traffic and an assumed spectrum of vehicle weights (the most frequent vehicles that contribute to fatigue damage are of generally similar layout and within a known range of weights) is determined and then converted to a constant amplitude stress range that would achieve the same damage at 2 x 10⁶ cycles. The detail category is not needed for this conversion, since all the design curves are parallel. The rules for determining the damage equivalent stress range (ΔσE) are given in BS EN 1993-2[2], sections 9.4.1 and 9.5.1, and in BS EN 1993-1-9[1], section 6. The design value of the nominal stress range is γFf ΔσE although since γFf = 1.0 according to the National Annex to BS EN 1993-2[6] the values are numerically the same.
[top]Design value of stress range (structural steel)
The design value of stress range may be determined as follows, with reference to the relevant clauses of BS EN 1993-2[2]:
- Determine the stress range Δσp due to the passage of the fatigue load model 3 vehicle. (Where there is a stress magnification due to local geometry that is not taken account of in the classification detail, determine an appropriate stress concentration factor kf (>1) and apply it as an amplification factor to determine a modified value of Δσp (see PD 6695-1-9[9] for guidance on the value of kf). Note that 9.4.1 does not mention modification on account of stress concentration but the kf factor is applied in the determination of modified stress ranges in BS EN 1993-1-9[1], sections 6.3 and 6.4, although it is applied there at the same time as the λ factor discussed below.)
- Determine a ‘damage equivalence factor’ λ in accordance with 9.5.2. This factor is the product of sub-factors as follows:
- λ1 is a damage effect factor that depends on the length of the critical influence line.
- λ2 is a factor that depends on intensity of heavy vehicles in the “slow lane”. Determination of this factor requires the parameter NObs (given by BS EN 1991-2[11], clause 4.6.1(3) and the UK National Annex[12]) and the ‘average’ weight of lorries (given by the National Annex to BS EN 1993-2[6] as 260 kN).
- λ3 is a factor that depends on the design life of the bridge. For a 120 year design life the value is 1.037.
- λ4 is a factor that allows for the effect of loading in lanes adjacent to that for which Δσp was calculated. The value depends on the influence coefficients for each lane and the average weight of lorries, which the National Annex[6] again gives as 260 kN for all lanes.
- The value of λ = λ1 λ2 λ3 λ4 but not more than the limit given by 9.5.2(7) (which is not varied by the National Annex).
- Determine the design value of the stress range as:

In the above procedure, determination of the parameters λ2, λ3 and λ4 depends on the slope of the fatigue curve, expressed as the parameter m, with m=5 for structural steel under direct stress. (This is the slope of the ‘transition’ part of the design line, mentioned above.)
The same procedure is used for damage equivalent shear stress ![]() in structural steel.
in structural steel.
For shear stress in stud connectors, the value of m to be used in determining λv2, λv3 and λv4 is 8 and λ1 = 1.55 (for road bridges); there is no φ parameter - see BS EN 1994-2[4], section 6.8.6.2(4).
[top]Stress concentrations
The stress range that causes the crack to develop is the stress actually at the site of the crack, not the ‘average’ stress in the member. Thus, where there are stress concentrations due to local variations in stiffness or changes in geometry, a stress concentration factor (SCF) must be applied to the general stress level in order to determine a ‘modified nominal stress range’.
No values of SCF are given in BS EN 1993-1-9[1] or in its UK National Annex[5] but guidance is given in PD 6695-1-9[9], which is referenced by the NA[5]. Text books also give guidance on evaluating SCFs and some examples of fatigue-prone details can be found in published articles[13][14]. BS EN 1993-2[2] makes no mention of the modified nominal stress range or of the kf factor but it is a reasonable inference from the general statement in 9.1.2 that “Fatigue assessment should be carried using the procedure given in BS EN 1993-2[2] and BS EN 1993-1-9[1]”.
All connections and changes in section should be assessed for the effects of fatigue loading. Any feature for which a SCF cannot be determined through the use of published guidance should either be modified to permit simple evaluation or be suitably analysed by finite element modelling to determine the SCF. Testing may also be used.


Note on above figure*
Stress concentration around bolt holes is taken into account in the detail category
[top]Fatigue verification for structural steel
There is some duplication in the verification procedures in BS EN 1993-1-9[1] and BS EN 1993-2[2]; this leads to some minor inconsistency in terminology but the intent of both is the same. In BS EN 1993-2[2], Section 9.5.1 the verification for direct stress is expressed as:

There is a similar expression for the verification of the fatigue strength in shear.
For the value of λMf, note that BS EN 1993-1-9[1] refers to both “damage-tolerant” and “safe-life” methods of fatigue assessment. BS EN 1993-1-9[1] recommends a lesser value of the partial factor on strength for the damage tolerant method but requires a regular in-service inspection and maintenance regime to ensure adequate reliability. The UK National Annex[5] specifies the use of the safe life method, unless otherwise agreed by the Maintaining Authority. For the safe life method, the value of the partial factor λMf given by the National Annex to BS EN 1993-1-9[5] is λMf = 1.1; the value for λMf,s (applied to shear studs) given in the National Annex to BS EN 1994-2[8] is 1.0.
Fatigue strength (structural steel)
In the verification expression, Δσc is the reference value of fatigue strength at 2 x 10⁶ cycles, which is numerically the same as the relevant detail category according to BS EN 1993-1-9[1] Tables 8.1 to 8.10.
Note that for some details, the fatigue strength is reduced for thick elements or where and adjustment is needed for the geometry local to the detail. These adjustments are shown in the Tables; for bridge steelwork the adjustment will be needed for butt weld details in thick flanges and webs (for thicknesses over 25mm).

Shear connection - interaction of shear and direct stress
In addition to the separate verifications of the category 80 detail for the flange to which a stud is connected and the fatigue resistance of the stud in shear, BS EN 1994-2[4], section 6.8.7.2 requires an interaction check for flanges in tension to which studs are attached.
Details that commonly require assessment
For composite highway bridges, the details most commonly assessed are:
- At the attachment of a transverse stiffener to a flange or a web
- Attachment of a web to a flange
- in flange
- in weld throat
- Transverse butt welds in flanges and webs
- At the attachment of shear studs to a flange
- Shear connector weld
- Bolted connections.
For guidance on the fatigue quality of welded details, see Guidance Note 2.12
[top]Fatigue verification for reinforcing steel
Where the reinforcing steel is in tension, the fatigue endurance must be assessed. Generally, a procedure similar to that for the structural steel is used but the calculation of stress range is more complicated and the fatigue endurance to which damage equivalent stress is evaluated is at 106 cycles instead of at 2 x 10⁶ cycles.
For fatigue assessment of reinforcement, the stress range may be due to a combination of global and local effects (i.e. global tension due to hogging bending and local bending due to the wheels of the fatigue vehicle). BS EN 1994-2[4], section 6.8.6.1(3) provides a way of combining the two effects (the damage equivalence factor is different for each, because the length of the influence line is different) but the total stress could conservatively be taken as a local effect.
The verification of fatigue endurance is expressed in BS EN 1992-1-1[15], section 6.8.5 as:

That is, the design resistance of the stress range should not exceed the design value of fatigue strength at N*(=106) cycles.
[top]Design value of stress range (reinforcing steel)
Rules for the determination of stress range in the reinforcement are given in BS EN 1994-2[4], section 6.8.5.4; it requires knowledge of maximum stresses as the fatigue vehicle traverses the bridge. The behaviour of the cracked concrete is non-linear, because of cracking and because of tension stiffening; the maximum stress range is therefore determined on the basis of the stress due to the maximum moment on the cracked composite section MEd, max,f plus an additional stress due to tension stiffening; the minimum stress is more complex to calculate but BS EN 1994-2[4], section 6.8.5.4(2) gives a simple expression, for the case where the minimum moment MEd,min,f also causes tensile stress. If the minimum moment causes compression, uncracked properties may be used to determine the minimum stress. Implicit in this procedure is the need to know the total moments on the composite section, not just those due to the fatigue vehicle. Note also that the weight of the fatigue vehicle is increased by a factor of 1.75 or 1.4, depending on location, according to BS EN 1992-2[3], Annex NN.2.1(101).
As for structural steel, the damage equivalent stress is determined from the stress range. BS EN 1994-2[4], section 6.8.6.1(2) gives the following expression for the equivalent stress range:
![]()
However, BS EN 1992-1-1[15] uses the term ΔσS,equ for this stress range and refers to BS EN 1992-2[3] for its evaluation for bridges. Annex NN.2 of BS EN 1992-2[3] gives a similar procedure to that in BS EN 1993-2[2] and described above but the rules in Annex NN.2 are slightly different:
- λs,1 is given by Figures NN.1 and NN.2
- The expressions for λs,2, λs,3 and λs,4 are different and the value of m to be used in determining them is 9 (rather than 5).
- An amplifier for surface roughness φfat is also applied (φfat is given in BS EN 1991-2[11], Annex B).
The design value of stress range is thus γF,fatΔσS,equ and the NA to BS EN 1992-1-1[16] gives the value of the partial factor γF,fat = 1.0.
[top]Fatigue strength (reinforcing steel)
BS EN 1994-2[4], section 6.8.3(2) refers to BS EN 1992-1-1[15] for the fatigue strength of reinforcing steel. BS EN 1992-1-1[15], section 6.8.4 gives the value of the resisting stress range ΔσRsk at N* = 106 cycles as 162.5Mpa for straight bars. However, for bent bars (including cranked bars) a reduction factor ζ (=0.35+0.26 D/φ) must be applied this is very severe for bars bent around a minimum mandrel diameter.
The design value of the fatigue strength is thus ΔσRsk/γS,fat and the NA to BS EN 1992-1-1[16] says that the value of the partial factor γS,fat (applied to reinforcement) is the same as that for strength and thus γS,fat = 1.15.
[top]Example of fatigue assessment for a 3-span bridge
A worked example of fatigue assessment for a 3-span bridge is available for download.
[top]References
- ↑ 1.00 1.01 1.02 1.03 1.04 1.05 1.06 1.07 1.08 1.09 1.10 1.11 1.12 1.13 1.14 1.15 BS EN 1993-1-9:2005, Eurocode 3. Design of steel structures. Fatigue, BSI
- ↑ 2.0 2.1 2.2 2.3 2.4 2.5 2.6 2.7 2.8 BS EN 1993-2:2006, Eurocode 3. Design of steel structures. Steel bridges, BSI
- ↑ 3.0 3.1 3.2 3.3 BS EN 1992-2:2005, Eurocode 2. Design of concrete structures. Concrete bridges. Design and detailing rules, BSI
- ↑ 4.0 4.1 4.2 4.3 4.4 4.5 4.6 4.7 4.8 BS EN 1994-2:2005. Eurocode 4. Design of composite steel and concrete structures. General rules and rules for bridges, BSI
- ↑ 5.0 5.1 5.2 5.3 5.4 5.5 NA to BS EN 1993-1-9:2005. UK National Annex to Eurocode 3. Design of steel structures. Fatigue, BSI
- ↑ 6.0 6.1 6.2 6.3 NA+A1:2012 to BS EN 1993-2:2006. UK National Annex to Eurocode 3. Design of steel structures. Steel bridges, BSI
- ↑ NA to BS EN 1992-2:2005. UK National Annex to Eurocode 2. Design of concrete structures. Concrete bridges. Design and detailing rules, BSI
- ↑ 8.0 8.1 NA to BS EN 1994-2:2005. UK National Annex to Eurocode 4. Design of composite steel and concrete structures. General rules and rules for bridges, BSI
- ↑ 9.0 9.1 9.2 PD 6695-1-9:2008, Recommendations for the design of structures to BS EN 1993-1-9, BSI
- ↑ 10.0 10.1 BS EN 1090-2:2018, Execution of steel structures and aluminium structures. Technical requirements for steel structures, BSI
- ↑ 11.0 11.1 11.2 BS EN 1991-2:2003, Eurocode 1. Actions on structures. Traffic loads on bridges, BSI
- ↑ NA+A1:2020 to BS EN 1991-2:2003, UK National Annex to Eurocode 1. Actions on structures. Traffic loads on bridges, BSI
- ↑ Kuhn, B et al. Assessment of Existing Steel Structures: Recommendations for Estimation of Remaining Fatigue Life. JRC Scientific and Technical Reports 2008
- ↑ Haghani, R et al. Fatigue-Prone Details in Steel Bridges. Buildings 2012, 2, 456-476
- ↑ 15.0 15.1 15.2 15.3 BS EN 1992-1-1:2004+A1:2014. Eurocode 2. Design of concrete structures. General rules and rules for buildings. BSI
- ↑ 16.0 16.1 NA+A2:2014 to BS EN 1992-1-1:2004+A1:2014. UK National Annex to Eurocode 2. Design of concrete structures. General rules and rules for buildings. BSI
[top]Resources
- Iles D.C. (2010) Composite highway bridge design (P356 including corrigendum, 2014). SCI
- Iles D.C. (2010) Composite highway bridge design: Worked examples (P357, including corrigendum, 2014). SCI
- Worked example of fatigue assessment for a 3-span bridge
- Hendy, C.R.; Iles, D.C. (2015) Steel Bridge Group: Guidance Notes on best practice in steel bridge construction (6th Issue). (P185). SCI
[top]Further reading
- Hendy, C.R.; Murphy, C.J. Designers Guide to BS EN 1993-2 Eurocode 3: Design of steel structures. Part 2 Steel bridges. Thomas Telford Ltd.